If you are a reader, I can guarantee you have heard of Goodreads, and probably have an account. However, a lot of people take issue with Goodreads as it is owned by Amazon. There are alternatives out there now, though! Of course, you have your standard Google Sheet/Excel spreadsheet to track on your own. If you want the networking aspect though, there is StoryGraph. It tracks things differently than Goodreads but is a similar option. Today I am sharing my StoryGraph review and whether or not it is worth using!

What Is StoryGraph?
StoryGraph is a website and app that allows you to track the books that you read and own, and quantify that data. Using your responses to a series of questions (more on that later), it shows you what kinds of books you are reading and enjoying. There is also a community feature; you can be friends with people and follow them. The focus is really on your own reading habits and info, though, which is different from Goodreads. (I am really fed-up with GIF-laden reviews on Goodreads, so this works for me.)
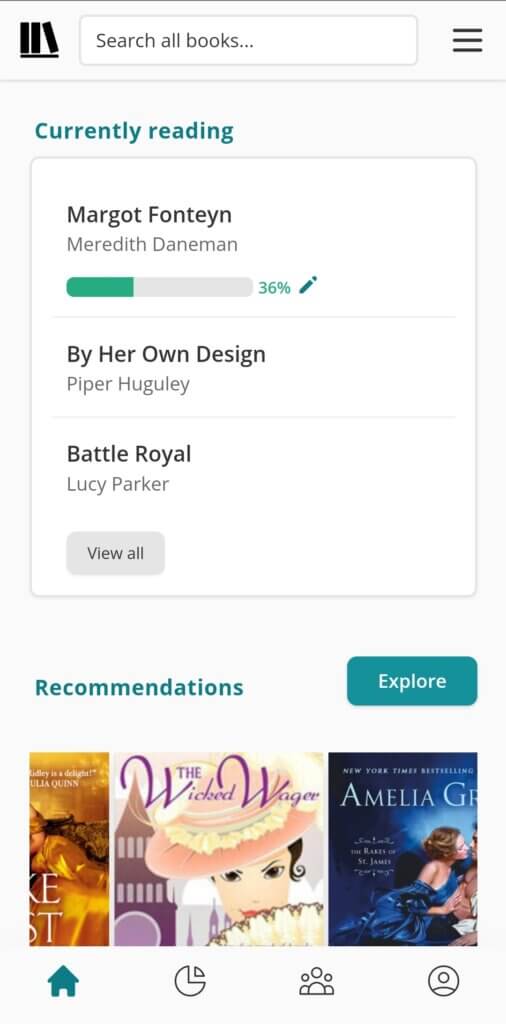
What Does StoryGraph track?
When you finish a book, StoryGraph asks you several questions that help categorise the book for your data. It asks about moods and pace, whether it is plot- or character-driven if the characters are lovable and if they are diverse if their flaws are prominent, and then a standard 5-star rating (where you can give .25, .5, and .75 stars).
In the screenshots in this post, you can see how it takes my answers and gives me a quantitative view of my readings.
It also allows you to track which edition and/or format of the book you own. (If you are a person who wants to know if you have a book in paperback or hardcover, you will love this feature!)

StoryGraph Plus?
StoryGraph itself is free to use, but there is a paid plan available under “StoryGraph Plus”. The paid plan is $4.99 USD/month or $49.99 USD/year. (The only currencies available as of August 2022 are USD, GBP, and EUR.) The paid plan gets you unlimited personalised recommendations, offers buddy-read suggestions for you and a friend, make recommendations on what you should read next on your to-read list, and allows for more comparisons using your data. I have not personally signed up for it, so I can’t comment on it. (It sounds interesting, but I have no shortage of books to read as is.)

My StoryGraph Review- 2024 UPDATE
I can firmly say that after 18 months of using StoryGraph, I am entirely converted. I started 2023 thinking I would update both GoodReads and StoryGraph as I went but by mid-July I had given up on GoodReads altogether.
StoryGraph is so easy to use. Because it is not bogged down by intrusive ads, it feels a lot smoother to me as a user. I’m not waiting for pages to load, and it does not go down anywhere like GoodReads does for me. I know that at the beginning of 2024 thousands and thousands of people moved over to StoryGraph and it was down for several hours at a time, over three days. However, that is first time that I’ve ever seen that happen- I cannot say that for GoodReads.
I also love that StoryGraph has a DNF category. As someone who is hoping to DNF more books that I am not enjoying, I am starting to use this feature more.
The data that StoryGraph can provide to me even with a free account makes me incredibly happy as a reader. I love being able to see my personal reading trends in front of me, including things like pace and mood. I very much read in “trends” throughout the year (ie. historical romances in the winter, cosy mysteries in the spring, etc) and see that data made me look at my reading in a new way. And the StoryGraph year end wrapped gives a lot of valuable information if you want to properly assess the state of your reading or quite frankly, if you just want to see some cool info on the books that you read!
Overall, this is one of my most used apps. I find it very easy-to-use, and it has only continued to improve over time. Call me a full StoryGraph convert!
I only started using StoryGraph in the spring, so I have limited use. However, I have been enjoying it thus far!
It is interesting to see my reading stats in graph form. I did not realise that so many of the books I’ve read lately have been medium-paced, for example. Obviously, we all interpret books differently, so we could read the exact same books and have different StoryGraph results. The GoodReads stats are very limited and quite frankly, just clunky to read.
My reading over the last 3-4 months has been mostly fiction, which works well for StoryGraph. For the few non-fiction books I’ve added there, it is less useful- plot and character are useful for fiction but not relevant for non-fiction. I may not go out of my way to add my non-fiction books to StoryGraph going forward and keep it for fiction.
So far, I only have a handful of friends on StoryGraph, and I am okay with that. It is fun to see what others are reading but this is focused on tracking my own reading. My feed is my own books and recommendations, which is quite different from Goodreads. (If you want to add me, you can find me as “AnHistorianAboutTown”.) I find that StoryGraph is a lot more streamlined. After 4 months, I have yet to find myself mindlessly scrolling StoryGraph- I go into the app with a purpose.
I will return to this post later in the fall with a longer-term update!
♠
Looking for more books to add to your to-read list? You can find my favourite historical fiction books about women here, and my favourite royal chick-lit books here!
If you are using the app, I would love to see your own StoryGraph review!
Cheers,
The Historian
Facebook | Twitter | Instagram | Pinterest

Curious if you are still using Storygraph and your experiences to date, now that it has been awhile since your original post?